Gold is considered an alternative asset class because its price often moves opposite to stock prices. The inflation-adjusted price of gold rose from 1969 to 1980, for instance, while stock prices fell. Gold fell from 1980 to 2001 while stock prices rose. The hypothesis here outlined is a possible explanation for the diverging prices.
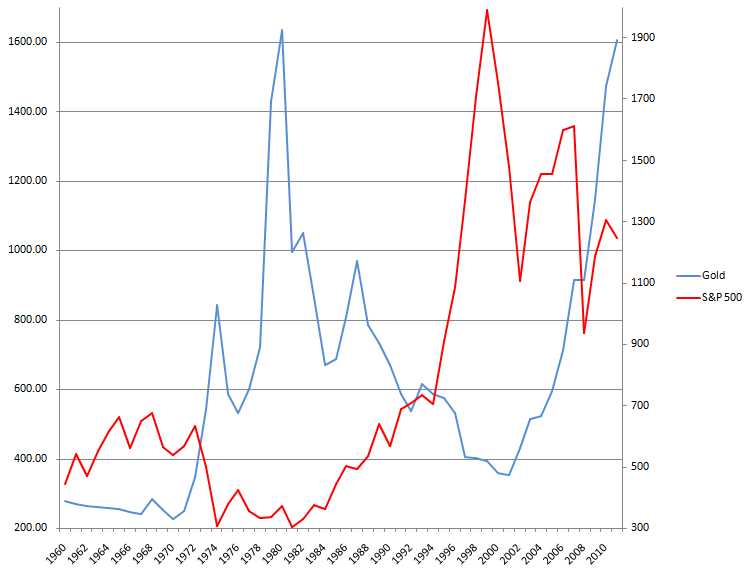
A primary purpose of gold is to serve as a hedge against inflation. Unlike stock, gold does not throw off dividends. Gold protects from fluctuations in the purchasing power of currency. The physical supply of gold is limited. It can not change as easily as the money supply. (To avoid confusion, the price of gold will be referred to in inflation-adjusted terms unless explicitly stated otherwise.)
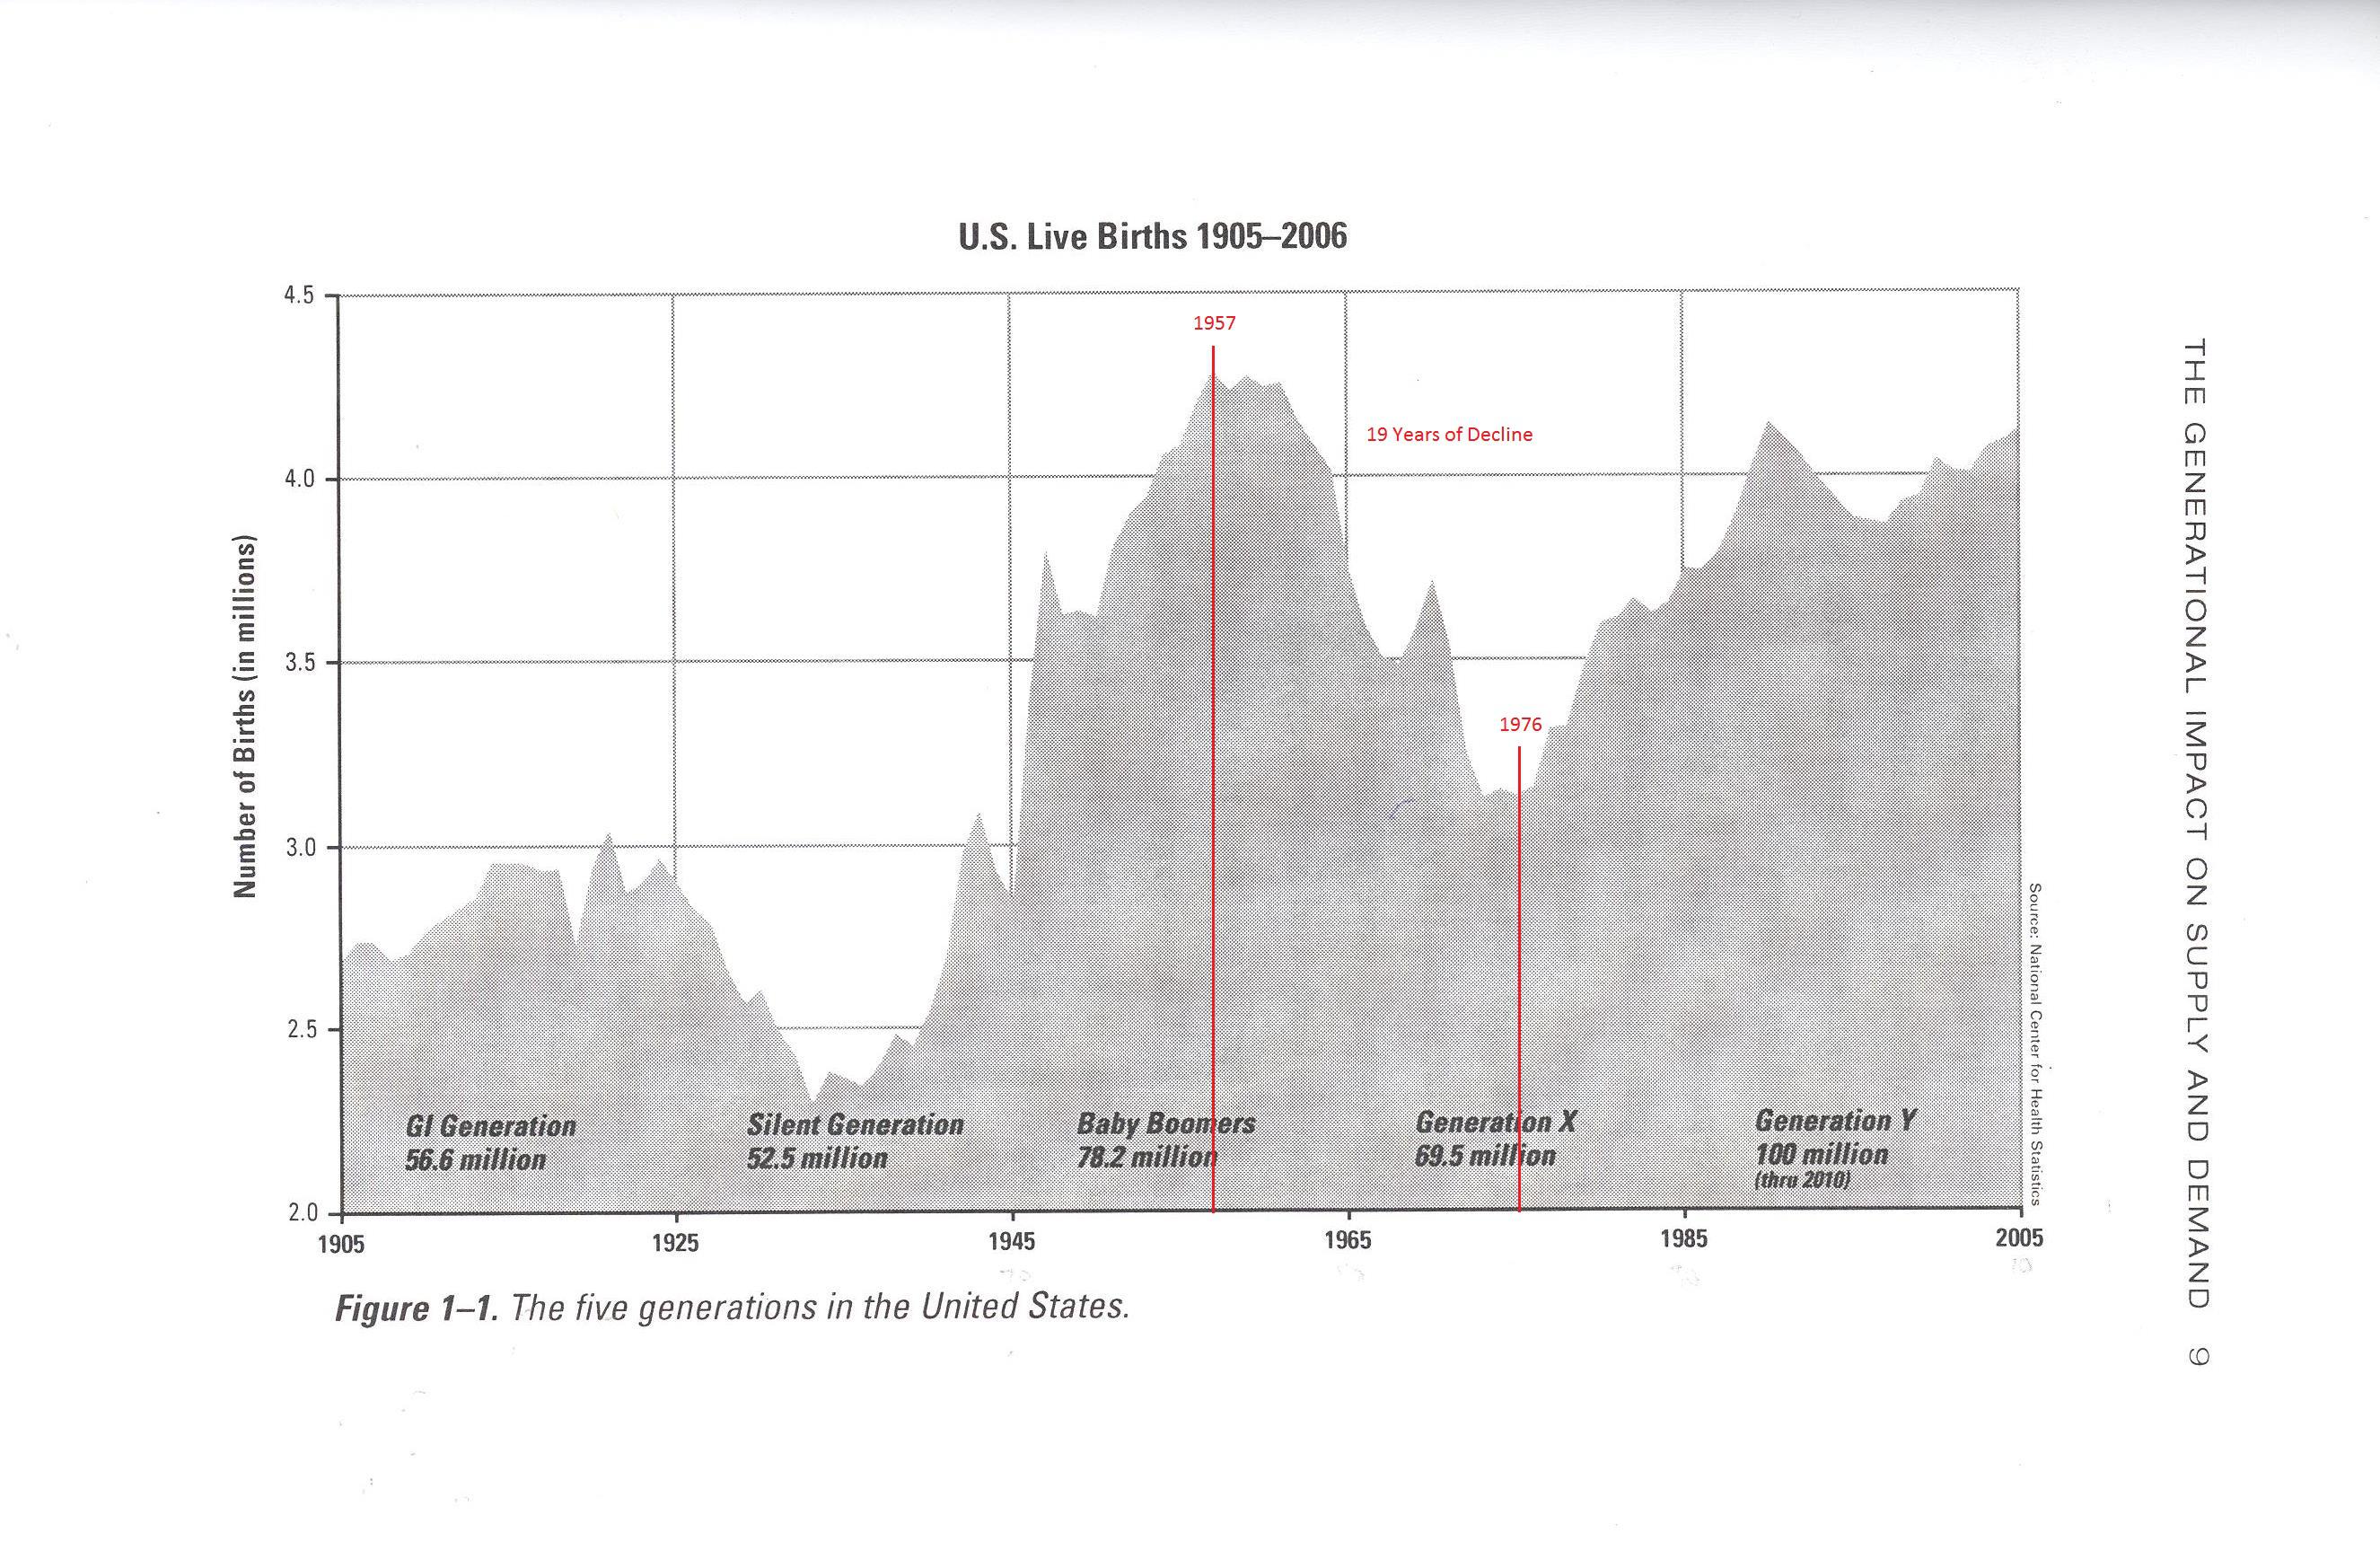
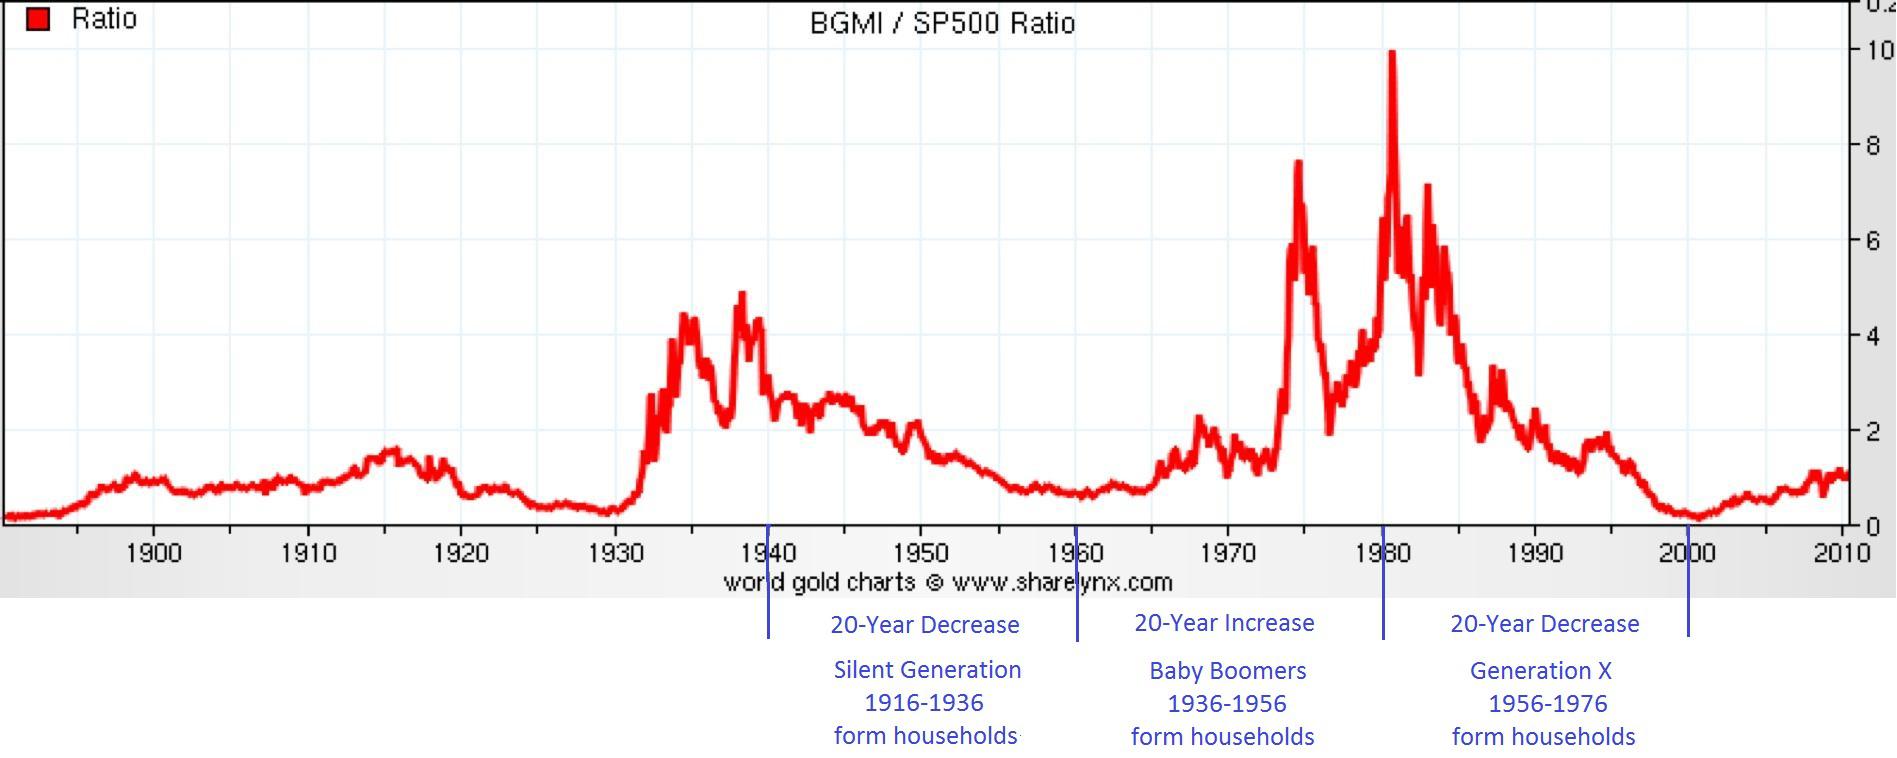
The price of gold rose from 1956 to 1980. This was a span of 24 years. Twenty-four years earlier, the number of births in the U.S. rose from 1932 to 1957. This was a span of 25 years.
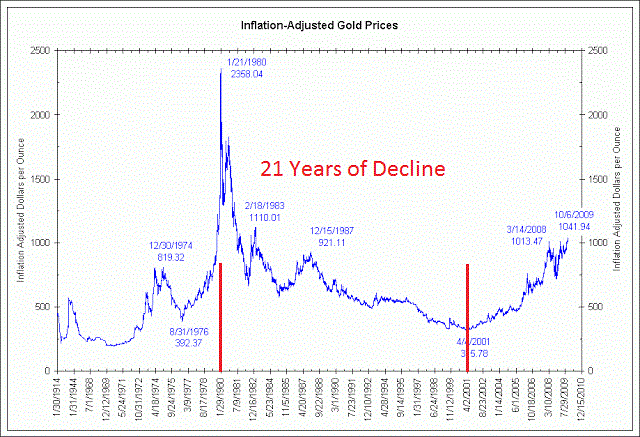
The price of gold fell from 1980 to 2001. This was a span of 21 years. Twenty-three years earlier, the number of births in the U.S. fell from 1957 to 1976. This was a span of 19 years.
Prices rose beginning in 2001, which was 24 years after the birthrate began rising in 1977. The birthrate continued to rise until 1990, a span of 13 years. This suggests that gold prices should have continued to rise until 2014. Quantitative Easing is believed to have triggered a rise in stock prices (companies have access to low-interest loans and there is the risk of rising interest rates in the bond market) but not inflation because of the slow economic recovery. Low inflation, paired with the explicit guarantee of low interest rates from the Federal Reserve, removed the reason to own gold as a hedge.
The hypothesis is that gold is sensitive to the uptick in spending of young adults. Approximately 24 years after a rise in the number of births, there is a rise in spending as couples prepare to form households. The spending spurs inflation and the price of gold.
- Births increased from 1932 through 1957. This was a span of 25 years. Inflation-adjusted gold prices increased from 1956 through 1980. This was a span of 24 years.
- Births fell from 1957 through 1976. This was a span of 19 years. Inflation-adjusted gold prices fell from 1980 through 2000. This was a span of 20 years.
- Births increased from 1977 through 1990. This was a span of 13 years. Inflation-adjusted gold prices increased from 2001 through 2014(?). This was a span of 13(?) years.
- Births fell from 1990 through 1997. This was a span of 7 years. Inflation-adjusted gold prices fell from 2014(?) through 2021(?). This was a span of 7(?) years.
- Births rose from 1997 through 2007. This was a span of 10 years. Inflation-adjusted gold prices rose from 2021(?) through 2031(?). This was a span of 10(?) years.
An earlier paper reviewed the time lag of 50 years from a rise in the number of births to a rise in stock prices. The idea was that 50-year-olds invest heavily in preparation for retirement. There is a decline in consumer spending for this demographic. The income stream, which remains intact until retirement, is diverted to investments. These new empty-nesters increase demand for stock and bid up share prices in the process.
The 50-year lag in the stock market is twice the length of the 24-year lag in the gold market. This explains the offset prices. An increase in the number of births results in increased spending 24 years later (household preparation) and increased investing 50 years later (retirement saving). The inflation that is associated with increased spending moves the price of gold. The additional demand for equities that is associated with increased saving moves share prices. The two periods overlap.
This implies that 26 years after a movement in the price of gold there will be movement in the stock market (50 - 24 = 26). Twenty-six years after the dates listed on the chart for the inflation-adjusted price of gold result in: Rising stock prices from 1995 to 2000, followed by declining prices until 2002 and then rising prices from 2002 to 2007. (The associated dates were 1969, 1974, 1976 and 1981).
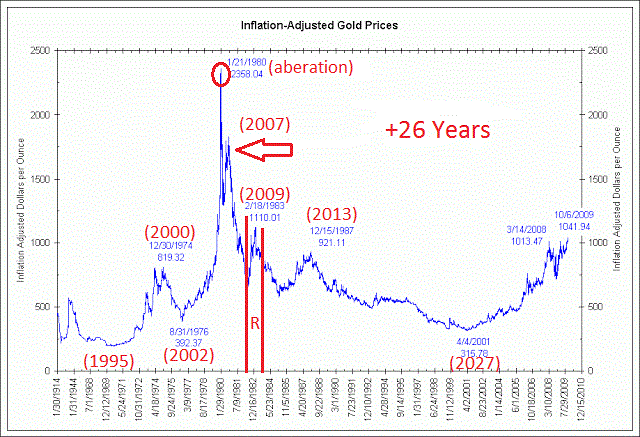
The stock market was then set to decline from 2007 to 2008 before rising in 2009. It was then set to decline again before peaking in 2013. (The associated dates were 1981, 1983 and 1987). In the stock market downtrend from 2013 to 2027, there is a temporary reprieve in 2019 and 2020. It is associated with the increased number of births from 1969 and 1970.
Adjusted for inflation, the S&P 500 is still below the high of 2007 and well below the high achieved in 2000. The tech bubble in the year 2000 drew investment from those who would not ordinarily be investors. The market's price-to-earnings ratio soared on this investment. Demand for stock proved to be an important factor for stock prices. Historically, the P/E ratio has been volatile as demand for stock increases and decreases. It is expected that the P/E ratio would remain virtually flat if profitability was the sole criterion of stock prices. Prices would rise when earnings rise and decline when earnings decline.
The uptrend for the stock market that is predicted to begin in 2027 is 50 years after the rise in births that began in 1977 and 26 years after the rise in gold prices that began in 2001. The year 2027 marks the beginning of a 13-year uptrend in the stock market. The uptrend ends in 2040, 50 years after births peaked in 1990. There is a weak patch in the middle of the period which runs from 2027 to 2040 but the overall upward tendency remains.
Increased spending on household formation increases inflationary pressure. This is one consideration that gold investors can add to all the other factors they must consider. The projected dates for the increases and decreases in the price of gold are not intended as set periods for an increase or decrease in value. The periods are intended as an overall indication of the inflationary pressure associated with an uptick in household formation.
The peak age on the bell curve of Generation Y is currently 23. These are the babies that were born in 1990. The number of births then declined until 1997 before peaking again in 2007. After 2007, births declined through 2011. A gold investor could use this information to predict trends in inflation. I have no position in gold or any gold exchange-traded fund (GLD), so I have no horse in this race.
The number of births peaked at 4,179,000 in 1990. As mentioned earlier in the article, this implies that the price of gold should have risen until 2014. The number of young adults making preparations to form households continued to increase until now. Despite this, gold peaked in 2011. Gold has since declined on slow economic growth after the recession and the assurance of low interest rates from the Federal Reserve.
The price of gold has already declined ahead of the seven-year decline which was predicted to begin this year. My expectation is that further declines in the price of gold during the next seven years (2014-2021) will be muted because the market has already factored in subsiding inflation with the decline that began in 2011.
The ten-year period which follows (2021-2031) indicates rising inflationary pressure on the increased number of births 24 years earlier. This section of the chart is jagged but the trend is upwards. The outlook for the price of gold then declines beginning in 2031 for at least the four years which follow. This is on the decline in the number of births since 2007.
Recap: Inflationary pressure is projected to decline from 2014 through 2021 and rise from 2021 through 2031. Pressure then declines from 2031 until 2035, at which point visibility is lost. Inflationary pressure from household preparation peaks in 2014 and 2031.
The effect of household formation on the inflation-adjusted price of gold has already peaked. The trend is down for the next seven years. The seven-year period is followed by an upward trend in the next ten years, to today's level. The trend then declines for four years.
At this point, I would like to reiterate that the tendency for increased inflation is only one of several factors that gold investors must consider. I have not studied precious metals extensively and emphasize that household formation is just one additional thing for gold investors to model.
I stumbled upon the relation to gold and inflation while looking for proof of a 28-year lag from changes in the birthrate to changes in interest rates. This is when spending kicks into high gear with the arrival of a couple's first baby. The hypothesis is that this dynamic causes enough inflation to alter bond prices.
Reference: Gronbach, Kenneth W. The Age Curve: How to Profit from the Coming Demographic Storm. New York: American Management Association, 2008. Print.
No comments:
Post a Comment